AutoGrid and AutoLigand

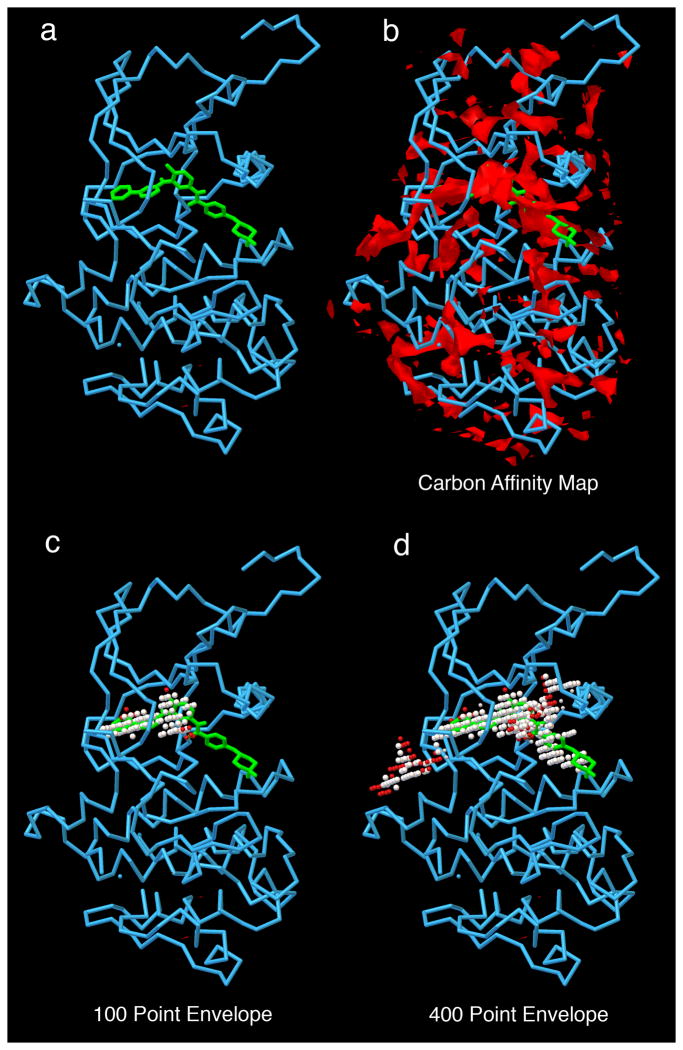
c-Abl tyrosine kinase is analyzed with AutoLigand. a) c-Abl with imatinib; b) carbon affinity map calculated with AutoGrid around the protein–notice the many disconnected areas of strong affinity; c) 100 point envelope identifies the regions of the active site that provide the strongest affinity for the drug; d) 400 point envelope includes the region of high affinity and also extends into adjacent solvent-accessible regions on the protein surface.
The maps calculated by AutoGrid may be used to visualize and analyze the surface characteristics of biomolecules. You can think of them as a spatial image of the molecules that bind to the biomolecule. We developed the program AutoLigand to use these maps to identify the regions of proteins that have strongest binding characteristics, localizing the preferred binding sites of ligands.
You can find more information about the science behind AutoLigand in:
Downloads
AutoLigand is included as part of AutoDockTools
AutoLigandTutorial_Jul2012 (PDF tutorial)
A short tutorial is also included in the Nature Protocols article:
Computational Ligand-Protein Docking and Virtual Drug Screening with the AutoDock Suite.
